(https://magazine.amstat.org/blog/2014/08/01/fellow-award-2014/)
Katherine Monti
The 2014 ASA Fellow awards were presented at JSM in Boston, Massachusetts, on the occasion of the 175th anniversary of the association. This year, we had a record high of 63 new Fellows, selected from a near-record high of 118 nominations. The maximum number of fellowships awarded each year is limited by our bylaws to one-third of one percent of the membership, so the maximum number of awards grows with the membership.
What follows is an update to previous articles by Robert Starbuck appearing in Amstat News, most recently in the August 2012 issue.
Employment Sector
Between 2004 and 2014, the percentage of ASA members in each employment sector has remained relatively stable: 42% academe, 47% business/industry, and 11% government. These rates were reported in 2012 and the approximations are still valid.
The number of ASA Fellow awards given by employment sector for the most recent 11 years is presented in Table 1 and Figure 1.
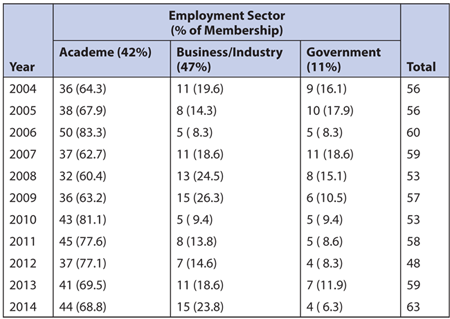
Table 1—Number and Percentage of ASA Fellow Awards in Each Employment Sector by Year
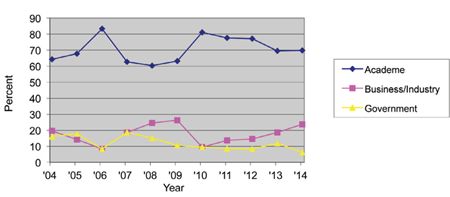
Figure 1. Percentage of ASA Fellows awarded in each employment sector by year
The percentages of Fellows awarded by employment sector relative to the percentages of ASA membership are shown in Figure 2. From Table 1 and Figure 2, it is clear that those in academe have been nominated at a consistently high rate and those in business/industry have been nominated at a consistently low rate relative to their respective proportions of membership. Government nominations have fluctuated the most in relative terms due to the smaller proportion of members; that is, a given change in the numerator of the ratio plotted is relatively influential for government compared to the other sectors because the denominator is so much smaller (11%) than those of the other two sectors (42% and 47%).
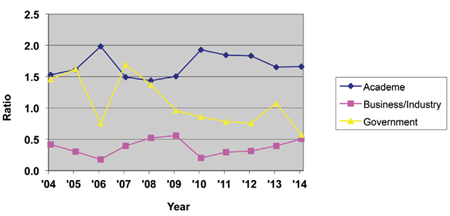
Figure 2. Percentage of Fellows awarded in each employment sector relative to the percentage of ASA membership in that sector by year
The yearly number and percentage of Fellow nominations in each employment sector are shown in Table 2. The 118 nominations received in 2014 made up the second-highest number of nominations submitted since 2004, exceeded only by the 120 nominations in 2007. Although more nominations in business/industry were submitted in 2014 than in any year in the previous decade, the proportion of nominations remained low. There were a high number of nominations from academe this year, while both the number and percentage of nominations from government were low.
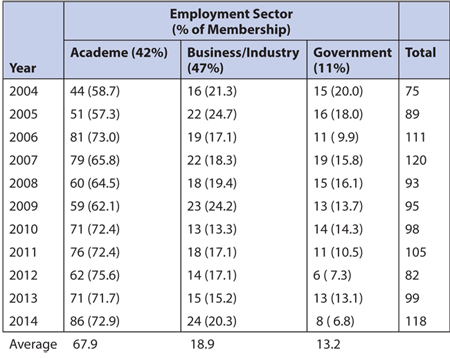
Table 2—Number and Percentage of ASA Fellow Nominations in Each Employment Sector by Year
One question of continuing interest is the rate of success for the nominations in each sector. As shown in Table 3 and Figure 3, nominations submitted from the business/industry sectors fared relatively well in the last two years, whereas academe has tended to have the highest success rate over the years summarized overall.
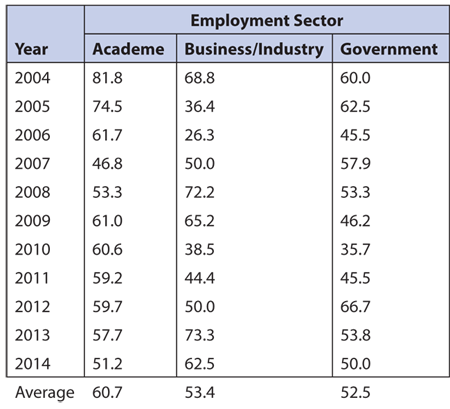
Table 3—Percentage of Successful ASA Fellow Nominations in Each Employment Sector by Year
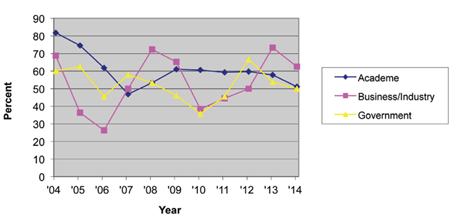
Figure 3. Percentage of successful ASA nominations in each employment sector by year
Gender
Table 4 and Figure 4 summarize the current ASA membership by gender and year of joining the ASA (or, if membership lapsed, rejoining the ASA). The summary is based on available data; more than 15% of ASA members have declined to enter their gender on their membership form. Among the current members who provide data, there is a definite trend over time in the proportion of female members.
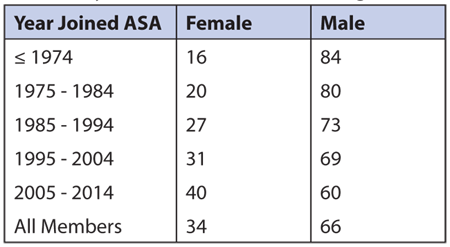
Table 4—Percentage of ASA Membership by Gender and Year of Joining
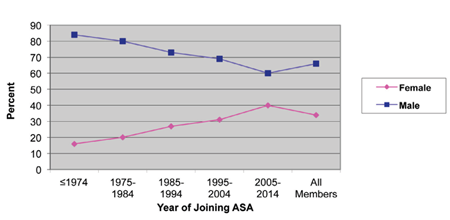
Figure 4. Percentage of current ASA members of each gender by year of joining the ASA
The number and percentage of ASA Fellow nominations for each gender in each year from 2004 through 2014 are presented in Table 5. The majority of the newly joined members are most likely relatively young (i.e., less mature in their careers) compared to most Fellow nominees, who tend to be mid-career. While there is a fair amount of year-to-year variability in the proportion of female nominations, there is an overall slight increase in the proportion of nominations for females over the last 11 years, which is consistent with the change in the proportion of females who are current members and who joined roughly 10–30 years prior to the year of award. This conclusion assumes that year of joining the ASA is a reasonable proxy for duration of career, the number of departures from ASA membership has been proportional to gender over time (i.e., females and males are equally likely to discontinue or retain ASA membership regardless of year of joining), and the reporting of gender also has been proportional to gender over time.
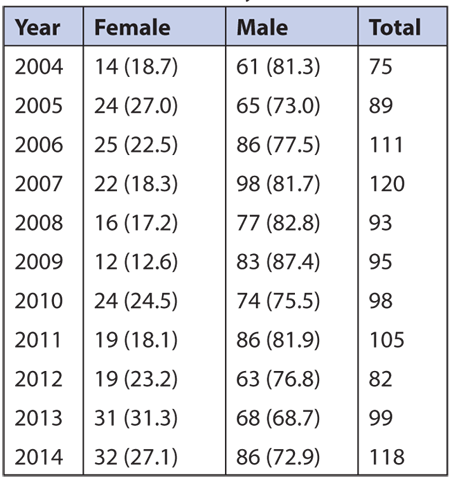
Table 5—Number and Percentage of ASA Fellow Nominations for Each Gender by Year
The number and percentage of ASA Fellow awards from 2004–2014 are presented by gender in Table 6, and the percentages are presented in Figure 5. Again, the increase in percentage of awards over time is consistent with the increase in female membership, with the percentage of awards increasing from about 23% (2004–2008) to 27% (2010–2014); 2009 was an outlier.
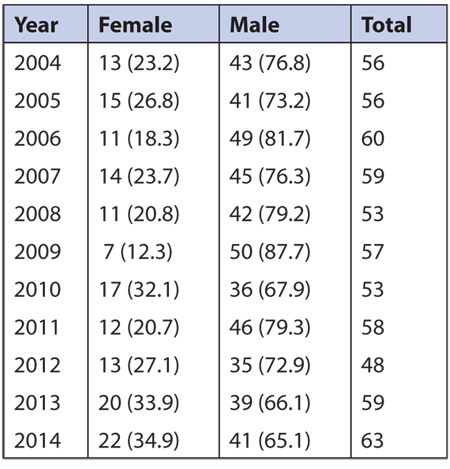
Table 6—Number and Percentage of ASA Fellow Awards for Each Gender by Year
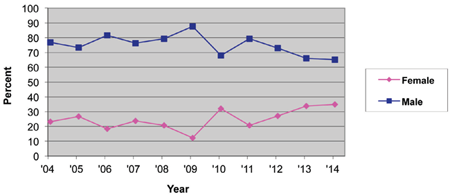
Figure 5. Percentage of ASA Fellow awards for each gender by year
Among nominees, the chance of success has generally been higher for females in the range of years summarized (Table 7, Figure 7).
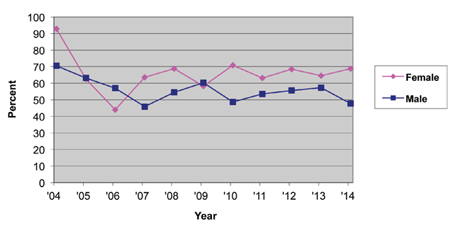
Figure 6. Percentage of successful ASA Fellows nominations for each gender by year
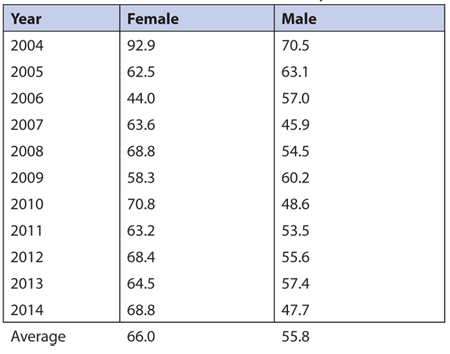
Table 7—Percentage of Successful ASA Fellow Nominations for Each Gender by Year
Conclusion
A key factor in being selected as a Fellow of the ASA is the quality of the nomination packet, but an essential factor is being nominated: no nomination, then no selection. Therefore, the number of nominations from a given employment sector or gender is an important determinant of the number of awards from that sector. Academe has both the highest nomination rate relative to membership and the highest rate of successful nominations. The business/industry sector has consistently been substantially under-represented in the number and percentage of awards given relative to the membership (Figure 2) largely due to the drastically lower nomination rate (Table 2). Compare the ratio of 67.9% percent of nominations to 42% of members in academe (ratio = 1.62*) with the ratio of 18.9% of members to 47% of members in business/industry (ratio = 0.40) to determine that the chances of being nominated have been, on average, about four times higher in academe than in business/industry (1.62 ÷ 0.40 ~ 4); the chances over time have been three times higher in government than in business/industry (ratio = 13.2 ÷ 11 = 1.20 for government, with 1.20 ÷ 0.40 = 3).
The ASA Fellow award is a significant recognition of contributions to the statistics profession and one that should reflect the constituency of the ASA’s membership. If you or others you know of are deserving of this award, participate in and encourage others to participate in the award nomination process. If you are early in your career, plan ahead: keep a log (at least quarterly) of your accomplishments and contributions; become active in ASA sections, chapters, committees, or publications (e.g., reviewer, associate editorship); publish your work that is not confidential; and generally use your creativity to expand your “job” into a meaningful career and make a notable difference. We encourage those planning a submission to review tips on the ASA website for guidance.
*In this case, the ratio of the averages—such as the 1.62 value computed above—is the same as the average of the yearly ratios because the denominator of 42% is used in each year and overall.