I am not a baseball fan myself, but in another context I was looking at streaks of events and had an example like below in my presentation. You can use the fibonachi series. I attached an Rmarkdown document with Rcode if anyone is interested.
```{r}
library(dplyr)
library(tidyverse)
nk=crossing( n = seq(2, 500, 2),
k = c(5,7,9) )
p=.5
q=1-p
fibonacci <- function(order) {
reduce(seq_len(1200), ~ c(., sum(tail(., order))), .init = c(1, 1))
}
nk %>%
group_by(k) %>%
mutate(exact = 1-fibonacci(k[1])[n + 2] / 2 ^ n) %>%
ggplot(aes(n)) +
geom_line(aes(y = exact, group = k, color = factor(k)), size=1) +
scale_y_continuous(labels = scales::percent) +
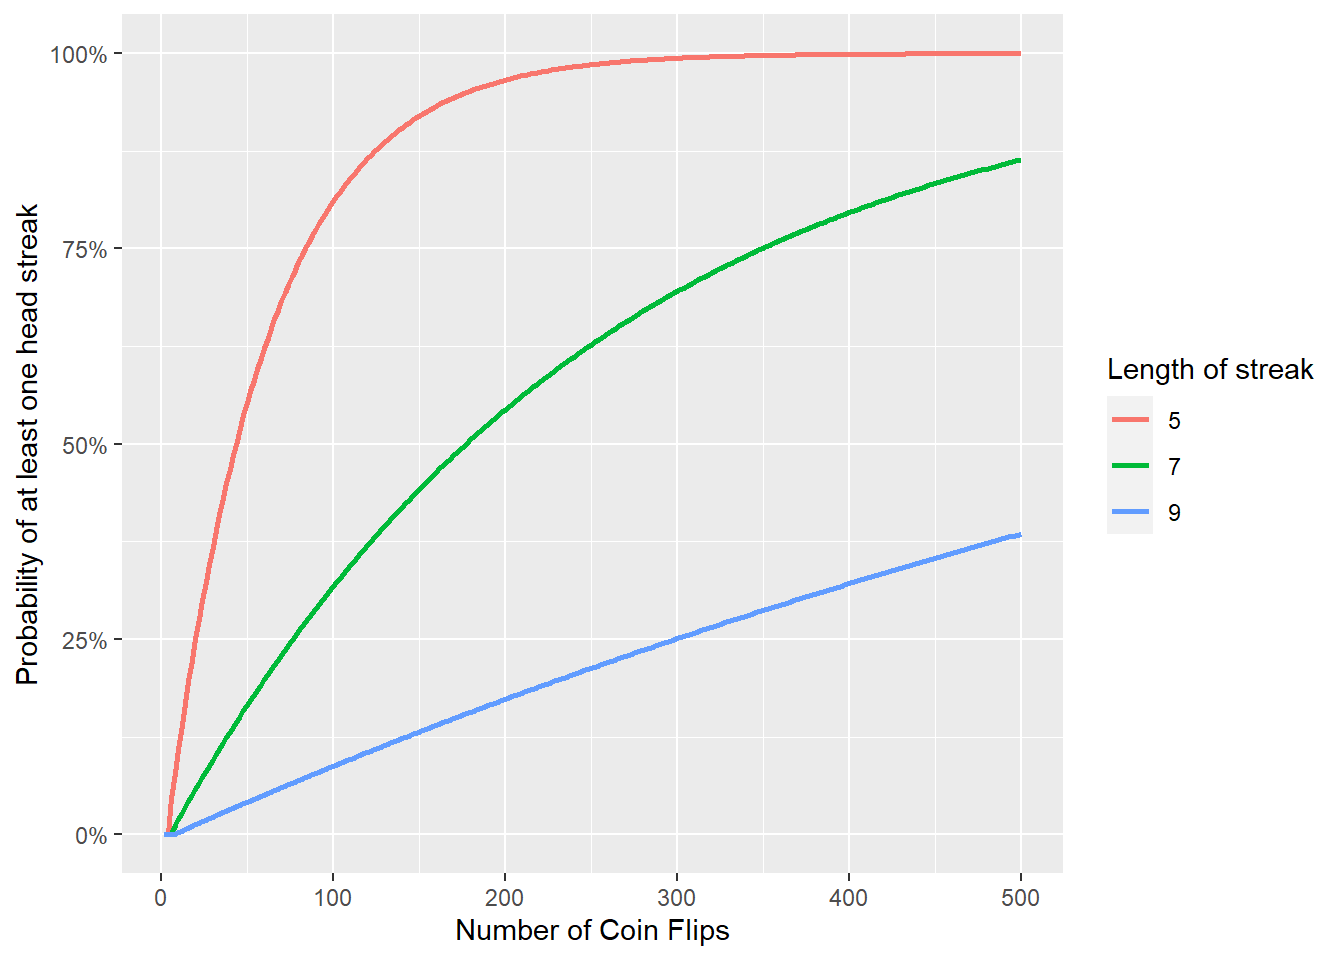
labs(y = "Probability of at least one head streak",
x = "Number of Coin Flips",
color = "Length of streak")
n=100
k=5
exact5 = 1-fibonacci(k[1])[n + 2] / 2 ^ n
k=6
exact6 = 1-fibonacci(k[1])[n + 2] / 2 ^ n
k=9
exact9 = 1-fibonacci(k[1])[n + 2] / 2 ^ n
```
The probability we have at least one streak of five heads in a row if we flip a coin 100 times is `r round(exact5,3)`. The probability we have at least one streak of nine heads in a row if we flip a coin 100 times is `r round(exact9,3)`.
The probability we have at least one streak of five heads in a row if we flip a coin 100 times is 0.81. The probability we have at least one streak of nine heads in a row if we flip a coin 100 times is 0.088.
------------------------------
Laura Kapitula
Senior Biostatistician
------------------------------