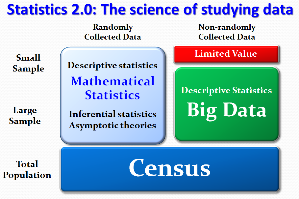
Statistics is the science of studying data, big or small.
When the concept of random sampling was first introduced in the late 19th century, it was debated for morethan 40 years before it was fully accepted as a scientific discipline [1]. The field of mathematical statistics grew and flourished with its focus on random phenomenon and analysis of representative data that are collected according to probability theory. Despite the relative smallness of the size of a random sample, Statistics 1.0 is well established in both theory and practice to make inference about the population.
Specifically, a 5% random sample is clearly superior to a 5% non-random sample in making statistical inference. As statistical experts, we warn against the use of non-random data because of its unknown bias and inflated variation. We condemn their use in producing misleading results – sinful acts that lack scientific rigor.
Since 2000, the new-found broad ability to capture and store massive amounts of electronic data ushered in the Big Data era. Big Data are almost always not collected according to probabilistic design and are frequently not even structured for conventional statistical analysis. It exposed a glaring weakness of the current statistics profession - its long ignorance and apathy towards non-randomly collected data.
When a congressman voted to terminate one of the largest nationwide surveys in the United States because the American Community Survey [2] is a random survey which he considered to be not scientific, it provided an iconic, alarming moment about the future of Statistics 1.0. Whether it is due to arrogance, complacency or fear, continued neglect of non-randomly collected data will likely reduce the influence and credibility of the statistics profession to irrelevance.
Big Data and advancing technologies offer an ideal opportunity to launch Statistics 2.0.
Descriptive statistics and exploratory data analysis have long been the starting point of many scientific studies. It has recently been reaffirmed [3] that “methods for visualization and exploration of complex and vast data constitute a crucial component of an analytics infrastructure.” Visualization and manipulation of complex data are necessarily core components of Statistics 2.0 to allow statistical story-telling.
A dynamic frame [4] retains the original functions of a traditional frame, captures the latest data in a timely manner, facilitates real-time analysis, allows for flexible expansion, and promotes innovative practices and products. Why would one not study the entire population if its costs are reasonable and can be delivered with high efficiency and quality similar to a random sample?
Bigness in data is a relative concept based on the sample size as a fraction of the population, not an absolute concept about file size. A sample of 60,000 households representing 90% of the households in a county contains substantial information about the county, even if it is not a random sample. On the other hand, the same number of 60,000 households has practically no value in making inference about the 120 million households in the U.S. unless it is collected according to probability theory. It does not matter whether the file size is one terabyte or one petabyte.
It is certainly true that non-random data contain biases of unknown magnitude that can contribute to misleading conclusions. However, sample estimates converge to the population values when sample size increases, including those from non-random samples. At a sample size of 100%, the bias dissipates if the samples are taken without uncontrolled measurement errors. Trade-offs between bias and size of non-random samples have seldom been studied by statisticians. Xiao-Li Meng’s recent ground-breaking paper [5] on this topic of statistical inference is undoubtedly worthy of nomination to the Nobel Prize for Statistics, or its equivalent.
While industry and government are spending billions of dollars annually on Big Data, the statistics profession is still pondering or lamenting about how to react to the presence of Big Data. Statisticians have accumulated expertise for the last century in statistical thinking and excel in such fields as statistical design, extraction of information for description and inference, and data quality control and management. Who else would be better qualified to embrace Big Data and initiate Statistics 2.0 with an expanded view and contemporary theories and methods?
More than 10 years have passed since the arrival of the Big Data era. Hopefully it will take less time than sampling did to debate, nurture, and grow Statistics 2.0 into a more vibrant, relevant and useful science of studying data.
Thanks to Dr. Xiao-Li Meng and Dr. Carson Eoyang for their insightful suggestions and edits.
REFERENCES
[1] Wu, Jeremy S. (1995). Chinese translation by Zhang, Yaoting and Yu, Xiang. One Hundred Years of Sampling, invited paper in “Sampling Theory and Practice,” ISBN7-5037-1670-3. China Statistical Publishing Company.
[2] U.S. Census Bureau. (2013). American Community Survey. Retrieved November 1, 2013 from https://www.census.gov/acs/www/.
[3] National Research Council. (2013). Frontiers in Massive Data Analysis. Washington DC: National Academies Press. Retrieved November 1, 2013, from http://www.nap.edu/catalog.php?record_id=18374.
[4] Wu, Jeremy S. and Guo, Junchi. (2013). Statistics 2.0: Dynamic Frames. Retrieved November 1, 2013 from http://community.amstat.org/Blogs/BlogViewer/?BlogKey=9c0b7f85-40a8-4fa4-b992-752d2e485a5e.
[5] Xiao-Li, Meng. (2013). A trio of inference problems that could win you a Nobel Prize in statistics (if you help to fund it) and personal communications. To appear April 15, 2014 in “Past, Present and Future of Statistical Sciences,” ISBN 9781482204964, CRC Press. With permission from the author to share upon request by contacting Jeremy.s.wu@gmail.com.