Timely all-cause death (ACD) counts, series that provide bases for excess death counts, have limitations that require adjustments. ACD counts in the USA come from state mortality databases. Reporting by some states lags that of other states, and states tend to revise counts upward as information about previously unreported deaths comes to light. The graph below shows counts on the horizontal axis and the "as of date", the date of an update of a count for a specific week. The different colors of lines represent series of ACD counts for weeks ending on the date shown in the legend. Data for the USA come from worksheets downloaded from
https://data.cdc.gov/NCHS/Provisional-COVID-19-Death-Counts-by-Week-Ending-D/r8kw-7aab on different dates.
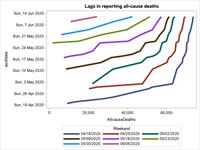
I'd say the graph shows that the counts may double from a report in a week to another report two weeks later. The slope of the curves turns toward vertical as the counts approach a more stable value, but small increases continue. Increasing slopes of the curves in more recent reports reflect, I suppose, slowdowns in reporting deaths in some states.
I've attached an Excel worksheet with data on the lags. See the concise SAS script that generates the graph below, in case someone has an interest in replicating or extending the visualization exercise:
libname allCause xlsx "..\DeathsReportingLags.xlsx";
proc sql;
create table weeks as
select * from allCause.weeks
order by weekend,asofdate ;
quit;
proc transpose data=weeks (keep = asofdate weekend allcausedeaths) out=lags;
ID asofdate ;
by weekend;
var allcausedeaths ;
run;
title 'Lags in reporting all-cause deaths';
proc sgplot data=weeks (where=(WeekEnd >= "18apr2020"d));
series x=allCauseDeaths y=asofdate /
group=WeekEnd lineattrs=(thickness=5);
run;
title;
Earlier I asked for national ACD data by county. No response as yet .... Timely tracking of excess death "hot spots" during the pandemic will depend not only on disaggregated data, but as well on estimates of local lags in reporting. National counts do not provide enough information for good estimates of regional differences in reporting lags.
As for the original question about the meaning of excess death models, it seems obvious when you think about the costs and benefits of different interventions aimed at mitigating the impact of the pandemic and its economic backlash, excess deaths measure a real cost of the pandemic to the nation. Any substantial reduction in life expectancy has to be taken into account when balanced against the benefits of opening hair styling salons, tattoo parlors, bars, and other venues that bring people into close contact. The claim that excess deaths in the pandemic mainly involves persons the medical system is keeping alive has no basis in evidence that I have seen, and it reeks of a "younger generation burden" premise that I have heard. Let evidence speak for itself in these benefit/cost trade-offs.
------------------------------
Sigurd Hermansen
------------------------------
Original Message:
Sent: 05-22-2020 17:43
From: Raoul Burchette
Subject: The meaning of excess deaths
I hope the excess death models will break out the data by age group and gender and preferably race as well. I really can't imagine that they wouldn't. I think there will be much to learn from them. Eventually, I would hope to be able to review attributed cause of death for these as well. All in its time.
I am sure that the CDC will put out a report (or model) in a year or so, but does someone have recommendations for sources in the nearer term? How soon will Yale put out their results once they revisit things in July? I would like to believe that there are several groups, NGOs, universities and agencies working on this. It will be interesting to compare the results.
------------------------------
Raoul Burchette
Biostatistician
Original Message:
Sent: 05-21-2020 08:05
From: Mark Czarnolewski
Subject: The meaning of excess deaths
One cannot overstate the implication that the estimating total deaths can have on determining the potential of a coronavirus resurgence. That resurgence may be impacted by the coronavirus spreading among the pockets of people who were less likely to be accessed by the healthcare system. For example, the NY Times documents the sections in Queens with a high concentration of coronavirus. Many of the likely victims were not even tested because when the paramedics arrived the potential patients had already passed away. Therefore, assuming that this scenario will continue, there are other likely potential victims in these sections of Queens. (Similar concentrations of hypothetically under-reported coronavirus victims and an analogous concentration of demographics more likely to succumb to the coronavirus may be found in the Bronx.) Nationally, deaths from, in order: heart disease, chronic low respiratory, cerebrovascular, Alzheimer's, diabetes and influenza/pneumonia diseases are more likely concentrated among those >=65 (DHHS/CDC, 2017). Thus, searching for this demographic will help identify a number of underlying conditions vulnerable to the effects of the virus. A CMS database containing those over 65 relying on electronic equipment can be helpful here. This issue is further compounded by the current dismantling and even harassing of social distance guidance.
Likewise, other demographic groups, such as African-Americans and Hispanics, who have a disproportionate concentration of these medical conditions, may be similarly vulnerable to life threatening events, such as exposure to the coronavirus. So, given the spatial area concentrations containing populations with these risk factors, there is a need to proactively seek those with coronavirus symptoms.
It would be helpful to re-examine the supposed model shortcomings when they predicted many more potential victims. Perhaps, the results from the excess deaths analyses will show that the models were much more right than wrong.
------------------------------
Mark Czarnolewski
Original Message:
Sent: 05-18-2020 15:49
From: Raoul Burchette
Subject: The meaning of excess deaths
I was wondering what people felt was the information that can be extracted from data on excess deaths. Here in the United States, I feel the number gives an estimate of the number of people being kept alive by the medical system. Where the system is disrupted, those who are dependent on the system (such as it is) are more likely to die, either because they cannot get necessary medications or necessary procedures, or because something prevents them from getting essential care. I was wondering what other implications or explanations people can infer from knowledge of excess deaths?
Raoul Burchette
Biostatistician
------------------------------
Raoul Burchette
------------------------------