ASA Connect

 View Only
  • 1.  Global Warming

    Posted 06-23-2015 09:33

    I plotted the autocorrelation and partial autocorrelation functions of the global warming series as well as its differenced version. These  plots support the model

    random walk + drift + error

    which I fitted for the period 1880 - 1999, and then predicted the values for 2000-2015.

    It turns out that the observed values 2000-2015 are, with three exceptions, above the prediction line. Thus, the exercise supports the view that global warming may still be going on, see the figure http://users.jyu.fi/~junyblom/Globalwarming.pdf. The R code together with some explanations is available at http://users.jyu.fi/~junyblom/Globalwarming.R.


    ------------------------------
    Jukka Nyblom
    University of Jyvaskyla, Finland
    ------------------------------


  • 2.  RE: Global Warming

    Posted 06-24-2015 11:37

    Thank you for this Dr. Nyblom. There have been a few posts that I have found informative in this recent discussion but yours is by far the best I think. And you provided the information without scolding like a schoolmarm, which I think is the best way to go about it. Incidentally, my great-great-grandmother, Hilma Ollikainen, was from Turku. (I never met her but I imagine she would have preferred wintering in Florida.)

    ------------------------------
    Robert O''Brien
    ------------------------------


  • 3.  RE: Global Warming

    Posted 06-24-2015 12:05

    The global temperature series is interesting. I analyzed it with several models (including difference and trend stationarity) and discussed model comparisons (both in-sample and

    out-of-sample), short- and long-term forecasts and the implications, model uncertainty, etc. The R code used is also included.

    I put it as a case study in my introduction text "An Introduction to Analysis of Financial Data with R" (Wiley 2013, Section 3.2, Chapter 3).

    I extracted the section, called it ch3case2.pdf, and put it on the book web:

    faculty.chicagobooth.edu/ruey.tsay/teaching/introTS/


    Sincerely,

    Ruey


    ​​​​​--

    Ruey S. Tsay

    H.G.B. Alexander Professor of Econometrics & Statistics

    Booth School of Business, University of Chicago

    5807 S. Woodlawn Avenue, Chicago, IL 60637

    Fax: 773-702-0458; Tel: 773-702-6750

    Email: ruey.tsay@chicagobooth.edu

    faculty.chicagobooth.edu/ruey.tsay


  • 4.  RE: Global Warming

    Posted 06-25-2015 01:45

    I still think there is a big piece missing from this discussion: the data itself. Everyone takes the time series and assumes:

    1. The accuracy of measurements are all the same. How comparable is a temperature measurement in 1880 to one in 2015? Not just who reads it and what instrument is used, but where it is placed. Then, what "adjustments" have been made and by whom? I am still interested in understanding the exact sources of the original, unadjusted data: where it is measured, when, by whom, with what instruments, with what accuracy, etc.

    2. That the measurements represent a "global average". The surface of the earth is about 200 million square miles. Temperatures vary from, say, -20s degrees C to + 35 degrees C. 70% of the surface is over water. The temperature changes over the entire year in a single spot. How many measurements does one need over space and time to get an average with a std. dev. of even 1 degree C? How would you sample? I understand that in the past few years, we have satellite measurements, but in 1880? 1890? 1920? In what sense are these measurements a "global average"?

    What am I missing? It would seem as though the uncertainty would be very large. Surely this has been addressed somewhere.

    I'm sorry if I am "intellectually lazy", but I just don't understand the data and its accuracy.

    ------------------------------
    Terry Meyer
    ------------------------------


  • 5.  RE: Global Warming

    Posted 06-25-2015 14:42

    I agree with Terry on multiple points, a single linear time series analysis to "prove" global warming is, IMO, hopelessly naive. From what I understand, better analysis is done by breaking up the earth's surface into pieces and analyzing temperatures for those pieces and building models to assimilate the temperature trends globally with a large (1000+ variable) multivariate model. Look up 4DVar and Ensemble Kalman Filters as a place to start.

    As well, data accuracy and integrity should not be overlooked. It's a huge issue and very controversial.


    ------------------------------
    Max Nevill

    ------------------------------


  • 6.  RE: Global Warming

    Posted 06-26-2015 09:27

    Please  Before dabbling, try reading some of the science

    eg, June 26, Science magazine, Karl et al. 1469-1472

    ------------------------------
    Michael Luvalle
    ------------------------------


  • 7.  RE: Global Warming

    Posted 06-26-2015 16:57

    The starting and ending years of the model can influence the appearance of changes in recent global warming.

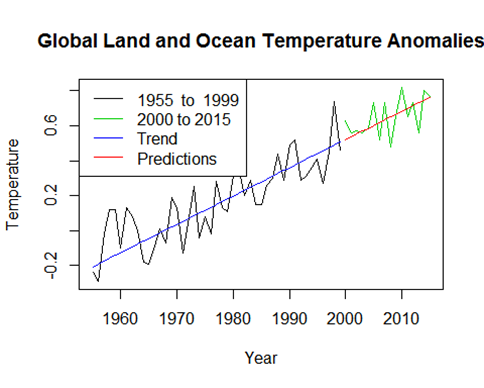
    As pointed out by Jukka Nyblom only 3 observed points are below the predicted line 'Thus, the exercise supports the view that global warming may still be going on.' That is, the green observed data are very strongly above the red projected line.  

    The starting year of the modeling influences our opinion as to the changes in recent warming compared to projections.  Perhaps based on concerns for data quality or perhaps to fish for self-serving counter examples we start the modeling in 1945, 1955, or 1965.

    The 1945 based projection is rather flat with the recent data even more strongly above predictions.

    The 1965 prediction line is steeper and the recent data are mostly below the predictions which might be taken to suggest that global warming is decreasing.

    The choice of the ending year for the model can also change the visual impression.  If we start with 1880 and predict for 2001 to 2015 we see a little more balance above and below the prediction line (not shown) with 5 points below the line. The change from 2000 to 2015 does not produce a profound effect but it does suggest that year we end the model and start the prediction can influence the strength of our opinion about warming in recent years.

    Methods matter.


    ------------------------------
    Alan Forsythe
    ------------------------------